

Welcome to the fourth part of the Beats workshop. You can find the first workshop here. As usual, to keep each article as compact as possible, I will shortcut the code to snippets. If you want to see the complete code, please consult my GitHub page for this workshop. If Google brought you here, you might also check the other parts of the series.
Today, we have a look at probably the most popular beats: Metricbeat and Filebeat. Both are members of the Beats family, are open source and community projects, and are written in Go.
This workshop will be less technical than the others. The technical stuff, like installing Metric- and Filebeat will be completely in the GitHub repo. We will have a closer look at the intended purpose of these Beats and how they can be used best for your project.
This is the gameplan:
- I will describe each Beat in a short section
- I will describe the test scenario and the goals which both Beats need to achieve
- We will have a look at how much effort it takes to achieve the goals for each Beat
- We will have a look at how many system resources the different Beats allocate
- We will go through the upsides and downsides of each Beat
- In the conclusion, I will describe, when top use which Beat
With that being said, let’s jump right in!
A few words about metrics
At this point, I need to clarify what a metric in Metricbeat is. Metrics are values that are reported in fixed intervals from Metricbeat to Elasticsearch. These values can be of all kinds of types, from long to boolean and even strings. It is important to know that Metricbeat is not triggered by an event, but by a defined interval – for example, every 5 seconds. Even if nothing has happened when the metric has been created, Metricbeat will send a report. In that case, the metric would be an empty string, a zero, a false, or whatever it is defined for „nothing has happened“. If something has happened, for example, CPU 1 runs at 75% load, the metric could be 0.75 for CPU 1.
A brief description of Metricbeat
Metricbeat comes out of the Box with many modules for the most used applications. Nginx, Mysql, MongoDB, Prometheus, and many more have a module in the basic installation and can be configured with a minimum of effort. However: if your application or your metric is not part of the basic installation, you need extra effort. In the best case, you find the desired module in the Metricbeat GitHub repo, then you set up the Development environment, and compile Metricbeat with the new module. How to do that is described in my second workshop. But in most cases, you probably need to write your module and metricset. You will need for this at least a basic understanding of Go, you might even end up hiring a Go developer or letting a specialized company develop this module for you.
A few words about logs
At this point, I need to clarify what a log is for Filebeat: it is a file that is fed by events. An event could be a crash of an application, a login of a user, or other things that are important enough to write a record. Of course, a daemon could periodically send statistics of an application (which would match the definition of a metric) and record the measurements every 5 seconds to a log file. But if that daemon stops and does not send any data to the log file, for Filebeat, no event has happened and therefore no data will be sent to Elasticsearch. Or in short, Filebeat does not care if records are stored in intervals or completely arbitrary: it picks up new records whenever they come in.
Log records usually come with a timestamp. And while a log entry without a timestamp hardly makes sense, Filebeat sends the picked-up record even if there is no timestamp. Each record has the automatically added field @timestamp, which represents, the timestamp when Filebeat picked up the record.
A brief description of Filebeat
Filebeat, as the name suggests, is a Beat that tracks Logfiles and sends new records to the Elasticsearch cluster or Logstash. If Filebeat is stopped – perhaps for an upgrade – it will continue tracking the logfile from the last position as soon as Filebeat runs again. The ability to get restarted at any time – without losing data or sending duplicates – is guaranteed by a memory mechanism. This makes Filebeat a very robust tool to track and analyze logs.
Filebeat 8.1.0 comes with 71 modules. It comes with modules for locally stored logs like Log, Syslog, filestream, and journald – but also with support for network protocols and endpoints like TCP, UDP, Kafka, MQTT, and Google Workspace.
Filebeat is with the given modules ultra-flexible. It can be configured for any kind of input, file-based or over a network address. Adding new fields can be done by defining them in a configuration file. But it does not stop there: Filebeat comes with many processors. They can be used to transform the data before they are shipped to Elasticsearch. Many processors known from Logstash are implemented in Filebeat and reduce the processing needed on Logstash or Elasticsearch cluster.
Last but not least: Filebeat comes along with a handbrake if needed. It prevents you from overloading your ingest pipeline. The backpressure-sensitive protocol talks with Elasticsearch or Logstash and slows down Filebeat if needed.
The test scenario
In our simple scenario, we monitor the modification time of a file filebeat.log. It will be updated every 10 seconds with a new entry. The goal is, to send every 10 seconds a report that contains the latest modification date of filebeat.log. The report will look like this:
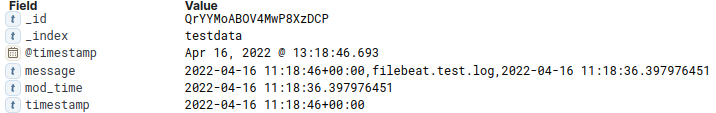
Using Metricbeat to send metrics to Elasticsearch
As a Metricbeat module, I will use the module we created in workshop 3. It has a bit of additional computing in it, but nothing that would make any difference.
Using Filebeat to send metrics to Elasticsearch
Since Filebeat reads events from logs, the task needs two steps: a simple shell script – called filebeat_logger.sh – that reads the modification time from filebeat.log every 10 seconds and writes it into itself. And a Filebeat instance that tracks the log file and sends the events to Elasticsearch.
Simple configuration of Filebeat
I will use a very basic configuration of Filebeat:
filebeat.inputs:
- type: log
  enabled: true
  paths:
    - /logs/filebeat.log
  exclude_lines: ["^\"\""]
  processors:
  - decode_csv_fields:
      fields:
        message: decoded.csv
      separator: ","
  - extract_array:
        field: decoded.csv
        mappings:
          timestamp: 0
          file_name: 1
          mod_time: 2
  - drop_fields:
        fields: ["decoded"]
Performance comparison
Let’s have a look at the memory and CPU consumption of Filebeat:
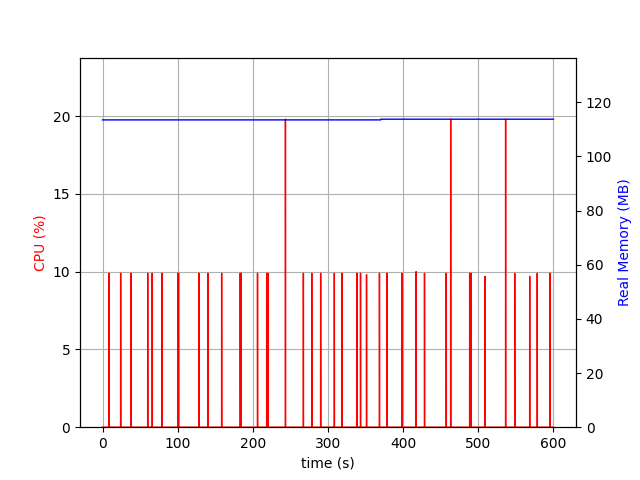
Filebeat uses 120MB of memory. The CPU is only used in very short spikes. 10% spikes are the majority, and there are also 3 spikes reaching 20% – during 10 minutes.
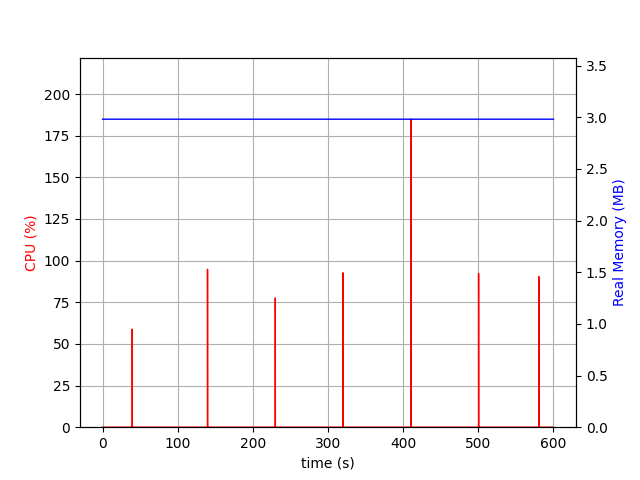
The logger needs around 3MB of memory and has here and there some strange spikes. It’s unclear to me why, but I also did not further research it. filebeat_logger.sh is a Bash script and I would, out of performance reasons, not suggest using Bash for writing a daemon. For this example, it did not matter, since it’s just a test.
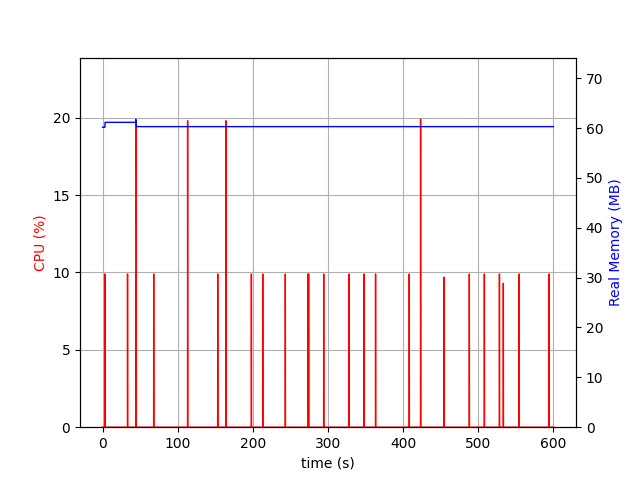
Metricbeat needs only 60MB of memory, which is half of what Filebeat needs. Interestingly it has the same CPU spikes as Filebeat. It can be said, that Metricbeat consumes as much CPU as Filebeat.
Up- and downsides of Filebeat
The huge advantage of Filebeat is its flexibility: there are almost no limits. And if I/O to disk is an issue, Filebeat can read from network addresses. With the processors, Filebeat gives a very powerful tool to transform data and enrich them before ingestion. With the backpressure-sensitive protocol, Filebeat has a safety mechanism implemented, that prevents your cluster from overloading. And Filebeat will not lose a single log record, even if Filebeat is not running temporarily.
Last but not least: in case something is going wrong, you have the log files locally. It can be a blessing and a curse. If your Elasticsearch cluster is not reachable, you can analyze your logs with grep and other tools. On the other hand, you need to manage your logs.
However: Filebeat is event-driven. If the logger daemon is stopped and no new data comes in, Filebeat will not care. The logger daemon will add up CPU and memory consumption. If resources are sparse or your logger daemon fires an extensive amount of requests, you might want to write the daemon in Go, C++, or at least Perl or Python, rather than Bash.
Up- and downsides of Metricbeat
The upside of Metricbeat seems obvious: it needs only half of the memory as Filebeat. Metricbeat will send every 10 seconds a report to Elasticsearch even if nothing has happened. With knowledge in Go, shippers with a very low memory footprint and almost endless possibilities can be created.
The downside is, that Metricbeat modules and metricsets are highly specialized, with specific fields and datatypes. You might be capable of creating a somehow generic module, but flexibility is not a strength of Metricbeat, and at a certain point you will be forced to create another module or metricset for an additional type of metric – and this will come with a price tag that is for sure bigger than measuring with a self-written daemon that sends data to Filebeat or Logstash.
Conclusion
As long as you are happy with the 73 modules that are provided with Metricbeat 8.1.2, you have a great tool for monitoring the most popular applications. And so far, the modules I came across are pretty straightforward to configure. Usually, Kibana dashboards are delivered for each module.
If you have an IoT device with limited memory, and storage, that should run a strictly limited amount of processes, and the metrics are defined upfront – then custom metricsets are probably the way to go.
Filebeat on the other hand, in combination with a logger daemon, gives you great flexibility and the ability to extend your monitoring framework quite easily. Filebeat is still an event-driven tool, but your logger makes sure, that the events are based on logged metrics. This is great in a dynamic environment where new requirements for monitoring are coming in constantly.
So in the end, it really depends, on where your priorities are. Flexibility versus performance. In a world where delivery times are crucial, I would go in most cases for Filebeat when it comes to metrics outside the ones you find in the standard installation.