

Welcome to the third part of the Beats workshop. You can find the first workshop here. As usual, to keep each article as compact as possible, I will shortcut the code to snippets. If you want to see the complete code, please consult my GitHub page for this workshop. If Google brought you here, you might also check the other parts of the series.
This workshop is built on top of the last workshop, which you will find here. All the preparations, the creation of the development environment and the creation of the skeleton for our custom metricbeat will you find there. If you want to speed up the process and skip reading that article, set up the dev environment as described in the article, clone the GitHub repo that stores the files of workshop 2, and you have everything you need for this workshop.
Today, we create a bit of a more sophisticated metricset – with a configuration that gives you more options and adds more intelligence to your shipper. At the end of this module, you will be able to create all kinds of metrics – with only a little knowledge of Go. You will be surprised by how easy it is to create a professional Metricbeat module.
However: part of the workshop will also be the deployment of your Metricbeat module. One thing we completely left out in the second workshop, was the packaging of your newly created Beat. Spoiler warning: Docker will be involved!
So, this is the gameplan:
- defining the use case
- defining the data structure
- defining the configuration for the module and the metricset
- coding the metricset
- compiling and configuring Metricbeat
- testing the metricset
- creating the Dockerfile
- building the image
- run the container and check the output
As you see, there is plenty of work to do – please grab yourself a tea and strap in for the ride. Enough with the talk: let’s jump right in!
Defining the use case
In the last part, we were only interested in monitoring a list of files. We did not define any threshold for an alert – we only sent the filename and the difference between the last modification time to the Elasticsearch cluster.
the input we need
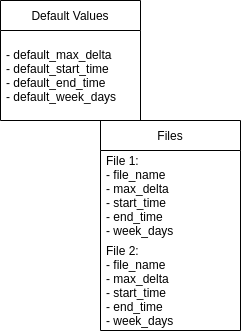
This time we add four more options per file. And we even define options for default values. This gives the user the ability to keep the YAML config file as slim as possible. Let’s identify the needed options:
- a filename (mandatory)
- a max delta in seconds (optional)
- a start time for alerts (optional)
- an end time for alerts (optional)
- the days of the week where the alerts should be raised (optional)
- default values for all options above except the filename
The config file will have a structure like this:
The processing we do
With the input (the options we set) from our YML config file, our processing will look like this:
- read each filename (field file_name)
- read each defined option (fields max_delta, start_time, week_days)
- we do some checks:
- we check if the filename exists. If not, we send a warning message to the cluster with the filename and a specific message.
- we check each of the optional fields if they are set. If not: we use the default values for the specific field
- we check the actual weekday and the actual time. We compare it with the weekdays and the start- and end time which defines the monitoring time window for the actual day. If we are in the time window and the actual weekday is a day to be monitored: our field „active“ is set to true. If not, our field „active“ will be set to false.
- we read the file statistics and compute the delta for the actual time with the timestamp of the last modification of the file. We store this in the field „delta“.
- Finally, we compare delta with max_delta and set the alter to true if the delta exceeds the value defined in max_delta
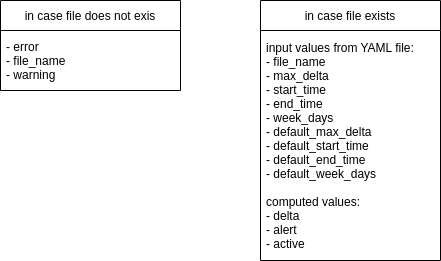
The output we send
If the filename exists, I would suggest sending all the input values together with the computed values, done in the processing step, to Elasticsearch. It makes debugging much easier. If not, we need only a specific error message, which we can monitor in ELassticsearch for finding files that are no longer existing (and therefore monitoring is either not needed anymore, or there is a deeper problem). The data structure we will send back will look like this:
Possible things to do with the output
A monitoring framework could be: having a watcher in the Elasticsearch cluster which raises alerts to your favorite tool (e-mail, Slack, Nagios, etc.) in case an alert is true and the monitor is active.
Defining the configuration for the module and the metricset
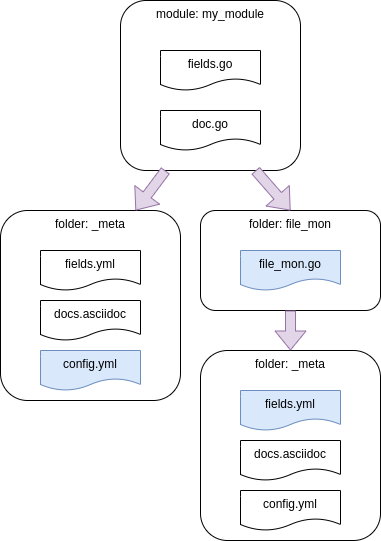
Since we created the data structure already in the last workshop, we need to change only a subset of our config files. Here you get an overview of the folder structure, the files we will change are marked blue:
As in the second workshop, the path
~/go/src/github.com/elastic/beats/metricbeat/module/my_modulewill be shortened from this point to „my_module“.
my_module/_meta/config.yml
First, we define the template that will be used to generate the file my_module.yml that will be created in /etc/metricbeat/modules.d during the metricbeat installation. A shortened version of config.yml in my_module/_meta needs to be placed like this:
- module: my_module
  metricsets: ["file_mon"]
...
  default_max_delta: 600
  default_start_time: [8,0]
  default_end_time: [22, 0]
  default_week_days: [0, 1, 2, 3, 4, 5, 6]
  files:
  - file_name: "/var/log/syslog"
    max_delta: 1200
    start_time: [7, 0]
    end_time: [22, 0]
    week_days: [1, 2, 3, 4, 5]
my_module/file_mon/_meta/fields.yml
We set now the field definitions of the structure defined in config.yml. This needs the correct data types since metricbeat will need it to create the right mapping in the index on Elasticsearch:
- name: file_mon
  type: group
  release: beta
  fields:
    - name: default_max_delta
      type: object
      object_type: long
    - name: default_start_time
      type: object
    - name: default_end_time
      type: object
    - name: default_monitoring_week_days
      type: object
    - name: files
      type: object
      fields:
        - name: file_name
          type: keyword
        - name: max_delta
          type: object
          object_type: long
        - name: monitorin_start_time
          type: object
        - name: monitoring_end_time
          type: object
        - name: monitoring_week_days
          type: object
Setting here the correct structure and core data types is crucial. If you are not sure which core data type you need, check the data types in the official documentation.
Coding the metricset
That’s it for the configuration files. We can now implement the specifications in our metricset.
define the needed data structure for the MetricSet
We define now the struct for the object MetricSet. While Go is not an Object-Oriented language, a struct could be seen as a collection of attributes of an object. Each attribute must be defined by a data type and if data is added to that struct, the datatype of the field must match with the data you add to that field. Therefore, when we work with a struct, the data we work with must be assigned to the correct field and have the correct data type. Since our default values are all lists of ints, we define them right in the MetricSet struct like this:
type MetricSet struct {
	mb.BaseMetricSet
	DefaultMaxDelta  int          `config:"default_max_delta"`
	DefaultStartTime []int        `config:"default_start_time"`
	DefaultEndTime   []int        `config:"default_end_time"`
	DefaultWeekDays  []int        `config:"default_week_days"`
	FileConfig       []FileConfig `config:"files"`
}
The label config:“xxx“ will be used to match the fields we defined in our configuration. The function „New“ will read the configuration and match it with the help of the labels.
As you can see, at the very bottom of the struct, I have a list FileConfig of the datatype FileConfig. This is nothing else than another struct with datatypes that we need to define. The struct FileConfig will hold the specific values we define for each filename:
type FileConfig struct {
	FileName  string `config:"file_name"`
	MaxDelta  int    `config:"max_delta"`
	StartTime []int  `config:"start_time"`
	EndTime   []int  `config:"end_time"`
	WeekDays  []int  `config:"week_days"`
}
Before we dive into the „New“ Method, we a function to return our MetricSet and FileConfig struct:
func returnConfig() MetricSet {
	return MetricSet{}
}
create the MetricSet instance
The New-method will call our function returnConfig() and receive the values in my_module.yml:
func New(base mb.BaseMetricSet) (mb.MetricSet, error) {
...
config := returnConfig()
...
return &MetricSet{
	BaseMetricSet:    base,
	FileConfig:       config.FileConfig,
	DefaultMaxDelta:  config.DefaultMaxDelta,
	DefaultStartTime: config.DefaultStartTime,
	DefaultEndTime:   config.DefaultEndTime,
	DefaultWeekDays:  config.DefaultWeekDays,
}, nil
}
We are now filling the struct MetricSet as we defined it. If there is anything found in the configuration, New() will unpack the data and fills our MetricSet struct with it.
Fetch the data and send it to Elasticsearch
Our fetch method reads the data stored in our MetricSet and saves it in the variable FileConfig. It holds the specific file configuration which we defined earlier as the struct MetricSet.FileConfig, we are calling it with the reference m.FileConfig.
func (m *MetricSet) Fetch(report mb.ReporterV2) error {
	FileConfig := m.FileConfig
Now, let’s read the actual time, year, and month. This is needed later:
act_time := time.Now()
year := act_time.Year()
month := act_time.Month()
Let’s iterate now through the file config and have a look at the first few lines in our loop:
for _, file_config := range FileConfig {
   f, err := os.Open(file_config.FileName)
One of the nice things about calling the standard Go libs is, that many of them return an error object. In our case it is very important, to make sure, that the file we are opening is existing. Otherwise, you will get a very nasty panic exception like this:
log.origin":{
     "file.name":"runtime/panic.go",
     "file.line":221 },
"message":
     "recovered from panic while fetching
     'my_module/file_mon' for host 'localhost'.
     Recovering, but please report this.",
"error":{
     "message":"runtime error: invalid memory
     address or nil pointer dereference" }
Therefore we evaluate the err object and if it is not nil, let metricbeat send a report to Elasticsearch – as we defined it in diagram 2:
if err != nil {
   report.Event(mb.Event{
       MetricSetFields: common.MapStr{
           "error":     "file not existing",
           "file_name": file_config.FileName,
           "warning":   true,
           },
       })
       continue
 }
We read now the statistics in the next block and compute the delta:
out, _ := f.Stat()
mod_time := out.ModTime()
difference := act_time.Sub(mod_time).Seconds()
delta := int(math.Round(difference))
Since the time.Sub().Seconds() method returns the number of seconds as float, we round it and cast it as int.
We set now default values for the variable alert and active – nothing extraordinary or worth explaining:
alert := false
active := false
The next few lines get the actual weekday. We test first if the file_config.WeekDays slice has actual data. If not we take the default configuration. Further, we test if the actual weekday is in the file_config.WeekDays slice:
if len(file_config.WeekDays) == 0 {
    file_config.WeekDays = m.DefaultWeekDays
}
for _, x := range file_config.WeekDays {
    if act_weekday == x {
        active = true
    }
}
We test now all the other file_config-values. If they are empty, we set the default values. The default values have to be called by the reference „m“ since we did not assign them to a variable:
if file_config.MaxDelta == 0 {
   file_config.MaxDelta = m.DefaultMaxDelta
}
if len(file_config.StartTime) == 0 {
   file_config.StartTime = m.DefaultStartTime
}
if len(file_config.EndTime) == 0 {
   file_config.EndTime = m.DefaultEndTime
}
We check now if we are now in the time window where the monitor should be active. If yes, we check if the delta exceeds the threshold and raise an alert if that is the case:
window_start := time.Date(year, month, file_config.StartTime[0],
                file_config.StartTime[1], 0, 0, 0, time.UTC)

window_end := time.Date(year, month, file_config.EndTime[0],
              file_config.EndTime[1], 0, 0, 0, time.UTC)

if window_start.Before(act_time) && window_end.After(act_time) && active {
   if file_config.MaxDelta < delta {
      alert = true
      }
   } else {
      active = false
}
Last but not least, we are sending the data, as described in Diagram 2:
report.Event(mb.Event{
   MetricSetFields: common.MapStr{
      "delta":      delta,
      "max_delta":  file_config.MaxDelta,
      "file_name":  file_config.FileName,
      "alert":      alert,
      "active":     active,
      "start_time": file_config.StartTime,
      "end_time":   file_config.EndTime,
      "week_days":  file_config.WeekDays,

      "default_max_delta":  m.DefaultMaxDelta,
      "default_start_time": m.DefaultStartTime,
      "default_end_time":   m.DefaultEndTime,
      "default_week_days":  m.DefaultWeekDays,
   },
})
That’s it. Time to test our metricset.
Compiling and configuring Metricbeat
If you set up your dev environment right, you should be able to change into the root folder of metricbeat and compile the new module and metricset with mage:
cd ~/go/src/github.com/elastic/beats/metricbeat
mage update
mage build
Before we test our module with the fresh compiled Metricbeat binary, you need to set up the metricbeat.yml config file for a connection to the Elasticsearch cluster. And since you cloned probably the latest metricbeat-version from GitHub, you need to add the following option to our metricbeat.yml:
output.elasticsearch.allow_older_versions: true
In case you want to see only entries from the new module you also need to disable the system module – it is enabled by default:
./metricbeat modules disable system
./metricbeat modules enable my_module
Testing the metricset
You might start Mericbeat with verbose logging:
./metricbeat -e -d "*"Check your cluster, if you see the data in the metricbeat index. Now what you should see with the default my_module.yml file is something like this:
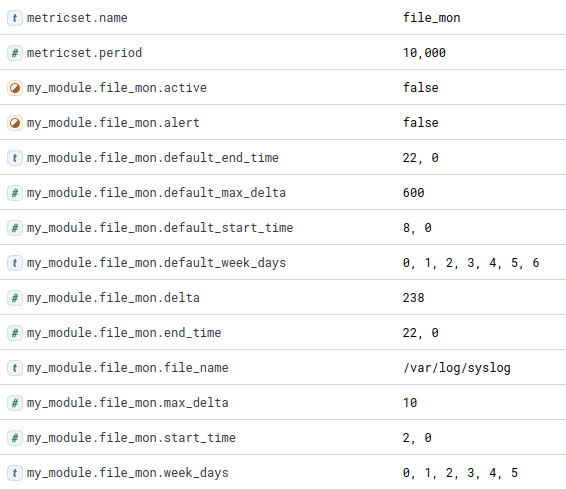
alert and active can be true or false. If you run Metricbeat, you should see a document that has the structure and contains the data above. This will look different when we run the same configuration later in a Docker container.
Build and deploy
If you are not already there, change to the metricbeat root folder, create an archive with everything we need to the package my_module.tar.gz, and copy everything in the new created folder ~/workspace:
cd ~/go/src/github.com/elastic/beats/metricbeat/
./metricbeat modules enable my_module
tar zcvf my_module.tar.gz \
   module/my_module \
   fields.yml \
   metricbeat.reference.yml \
   metricbeat.yml \
   modules.d/my_module.yml \
   metricbeat
mkdir ~/workspace
cp my_module.tar.gz ~/workspace
cd ~/workspace
With that package, you would be good now. You could copy it with sftp or tools like Ansible to every machine you want. Or you could create an rpm with it. Or create a Docker image and upload it to the Docker registry of your choice. We do the latter, let’s unzip the tar.gz-archive:
tar zxvf my_module.tar.gzCreating the Dockerfile
The image we create will contain the binary metricbeat that we compiled, the metricbeat.yml config file to connect automatically to our Elasticsearch cluster and the process runs with the user metricbeat:
FROM ubuntu:18.04

RUN useradd -rm -d /metricbeat -s /bin/bash -g root -G sudo -u 1000 metricbeat \
    && mkdir /metricbeat/modules.d \
    && chown metricbeat:root /metricbeat/modules.d \
    && apt update \
    && apt -y upgrade

USER metricbeat
WORKDIR /metricbeat

COPY metricbeat /metricbeat

EXPOSE 9200

CMD cd /metricbeat && ./metricbeat -e -d "*"
Building the image
We are building now the image with the Dockerfile and tag it as my_module version 1.0:
docker build -f Dockerfile . -t my_module:1.0Uploading the image to your registry
Here is the whole process for a new version 1.1. Don’t get confused, I use Nexus 3 as my local registry for Docker images, but it’s the same process with Harbor:
docker login -u xxx -p yyy srvnexus:8082
docker build -f Dockerfile . -t my_module:1.1
docker image tag my_module:1.1 srvnexus:8082/repository/dh/my_module:1.1
docker image push srvnexus:8082/repository/dh/my_module:1.1
Now you can pull your customized Metricbeat on every server that runs docker:
docker pull srvnexus:8082/repository/dh/my_module:1.1Creating a tar.gz archive of the Docker image
The docker image can be saved as a tar.gz-archive with „docker image save“:
docker image save -o my_module.tar.gz [image id]Run and test the Docker image
Time to run the container. Since we don’t want to build the image new, each time we change the my_module.yml or the metricbeat.yml file, we mount it directly from the local filesystem. You can distribute these config files via Puppet, Ansible, or any other deployment tool:
METRICPATH=$HOME/workspace/metricbeat.yml
MODULEPATH=$HOME/workspace/modules.d

docker run \
--mount type=bind,source=$MODULEPATH,target=/metricbeat/modules.d \
--mount type=bind,source=$METRICPATH,target=/metricbeat/metricbeat.yml \
-it [image id]
Check the created documents in Kibana, you will be surprised:
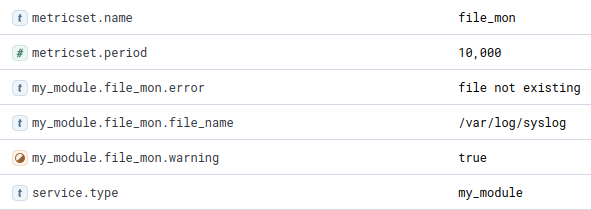
Yes, the file /var/log/syslog is not existing. Like in most Docker containers. OK, let’s change our file ~/modules.d/my_module.yml and add /var/log/lastlog as a second file to monitor:
  - file_name: "/var/log/lastlog"
    max_delta: 10
    start_time: [2, 0]
    end_time: [22, 0]
    week_days: [0, 1, 2, 3, 4, 5]
Start the container again:
docker container start $(docker container ls -lq)You should see the statistics for lastlog:
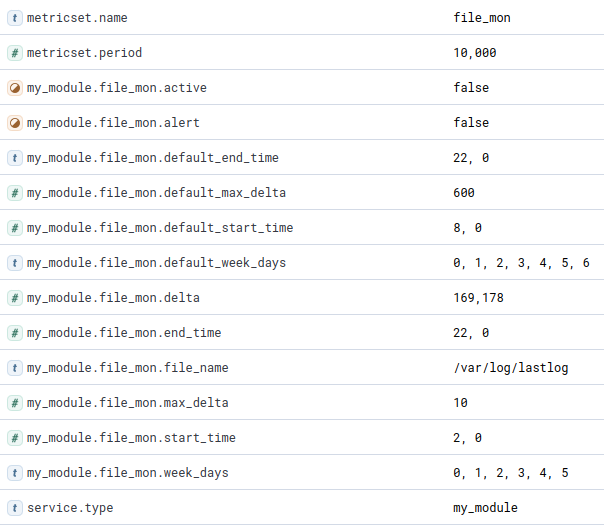
Download the image from docker.com
One last command: if you want to download the Docker image and just play around, it’s available on docker.com.
docker pull cdax75/workshop:my_moduleRun the container as we did it in „Run and test the Docker image“.
Conclusion
If you made it here: Congratulations! You should now be able to create your Metricbeat module and metricset and deploy it as a docker image. This was an example with a bit more intelligence than the first example. If you use the structure in file_mon.go as a blueprint, you should be able to create more complex metricsets.
If you have questions, leave a comment, connect or follow me on LinkedIn.
Have fun!