

Welcome to the first part of the Beats workshop. As usual, to keep each article as compact as possible, I will shortcut the queries to snippets. If you want to see the complete code, configuration, or queries, please consult my GitHub page for this workshop. If Google brought you here, you might check the other parts of the series.
Today, we will configure Metricbeat with secured communication. With Elasticsearch Stack 8, communication with SSL is enabled by default. The official documentation can be quite overwhelming and you might have a hard time finding the specific parameters. Besides SSL we will have a look at the specific privileges that need to be granted for Metricbeat. And last but not least, how the credentials for this user should be called safely. As always: let’s jump right in!
System topology for this workshop
The YAML files for Elasticsearch and Kibana are in full length on my GitHub page. The setup is quite simple: the Elasticsearch-node is exposed to the network as srvelk8. The Elasticsearch Version for this workshop is 8.0.1. Elasticsearch, Kibana, and Metricbeat are all running on the same VM. Here is what my /etc/hosts look like:
192.168.1.68 srvelk8 srvelk8.local.chThe root CA fingerprint
For secure communication, you need either the root certificate or the root CA HEX encoded fingerprint. I will show you both options, for now, we have a look at how you can get the fingerprint. You might have the fingerprint in your kibana.yml:
grep fingerprint /etc/kibana/kibana.yml

ca_trusted_fingerprint: a2929842b8920e5c0ebd91ea157c159f16b62df7e3b6998de93ad56ff2693b59}]
If you have access to http_ca.crt, you can extract the fingerprint with OpenSSL as well:
openssl x509 -fingerprint -sha256 -in /etc/elasticsearch/certs/http_ca.crt|\
  grep Fingerprint|cut -d  '=' -f2| tr -d ':'|tr A-Z a-z

a2929842b8920e5c0ebd91ea157c159f16b62df7e3b6998de93ad56ff2693b59
Installation
Install Metricbeat with:
curl -L -O https://artifacts.elastic.co/downloads/beats/metricbeat/metricbeat-8.0.1-amd64.deb
sudo dpkg -i metricbeat-8.0.1-amd64.deb
apt-mark hold metricbeat
If you want to use APT at Ubuntu, please have a look at the official documentation.
Creating the necessary roles and user
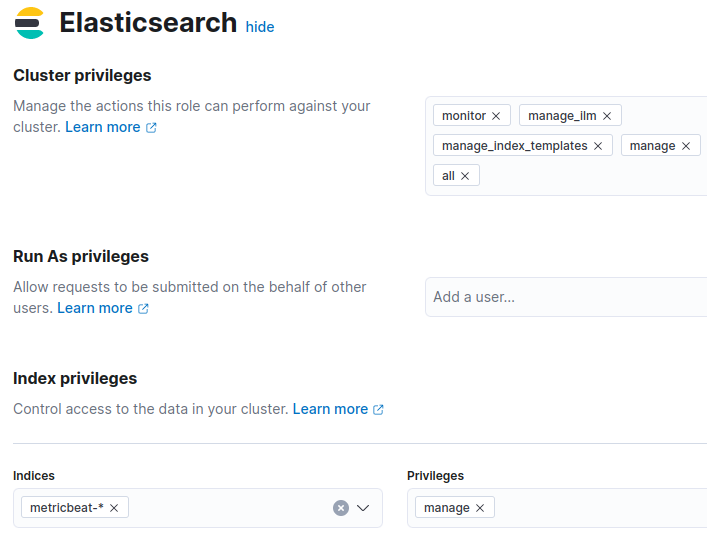
First, we need a role to set up Metricbeat in Kibana/Elasticsearch. After the initial setup, you will remove this role, since it is not necessary anymore. Create now the role „metricbeat_setup_role“ with these privileges:
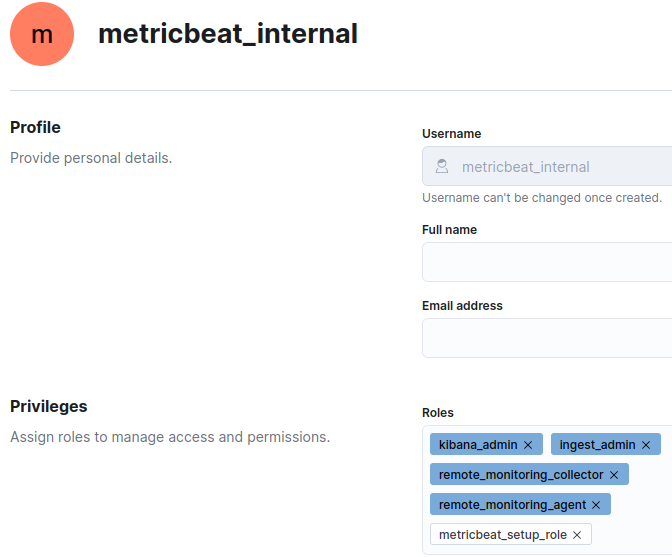
Now create the user for Metricbeat. I go for now with metricbeat_internal:
Create a Keystore
Because you don’t want to store the username/password in the yml-files, we need a Keystore that encrypts the credentials and stores them in a safe place:
metricbeat keystore create
metricbeat keystore add MB_USER
metricbeat keystore add MB_PW
We can define now in the YAML-files username and password as „${MB_USER}“ and „${MB_PW}“. The keystone itself is stored in the same folder as defined in „path.data“ – in Ubuntu per default in /var/lib/metricbeat. Run the keystone command with the same user that runs metricbeat.
Important: define a password that contains at least one letter. Otherwise, the password will be stored as an int, instead of a string – which will lead to problems later.
Configuration
You can now enable all modules that you need. Since I use Metricbeat for Stack Monitoring, I enable the Elasticsearch, Kibana, and Beat modules:
metricbeat modules enable elasticsearch-xpack
metricbeat modules enable kibana-xpack
metricbeat modules enable beat-xpack
metricbeat.yml
As an example, the section for the Kibana setup:
setup.kibana:
  host: "http://srvelk8.local.ch:5601"
  username: "${MB_USER}"
  password: "${MB_PW}"
  ssl:
    #certificate_authorities: /etc/elasticsearch/certs/http_ca.crt
    enabled: true
    ca_trusted_fingerprint: "a2929842b8920e5c0ebd91ea157c159f16b62df7e3b6998de93ad56ff2693b59"
As you can see, I disabled the certificate_authorities. Since I use the fingerprint, certificate_authorities is not needed. We also avoided defining username and password as cleartext.
module configuration
The same goes for the modules. Here is an example with elasticsearch-xpack.yml:
- module: elasticsearch
  xpack.enabled: true
  period: 10s
  hosts: ["https://192.168.1.68:9200"]
  protocol: "https"
  username: "${MB_USER}"
  password: "${MB_PW}"
  #api_key: "TxDLW38BJmYfkUzINFEF:0foLANnlS-qMNgx_jEXhGw"
  ssl:
    #certificate_authorities: /etc/elasticsearch/certs/http_ca.crt
    enabled: true
    ca_trusted_fingerprint: "a2929842b8920e5c0ebd91ea157c159f16b62df7e3b6998de93ad56ff2693b59"
Since each module differs a bit from the others, please have a look at the examples on the GitHub page.
Setup Metricbeat
Run now „metricbeat setup -e“. After a while, you should see these messages:
metricbeat setup -e

Index setup finished.
Loading dashboards (Kibana must be running and reachable)
Loaded dashboards
Create a monitoring role
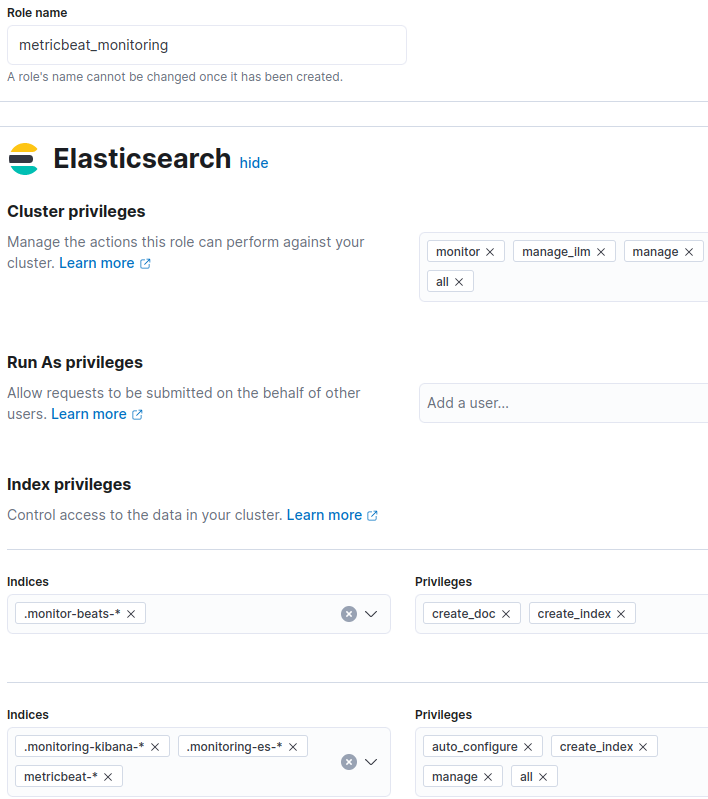
Create now the monitoring role for Metricbeat. After adding the role „metricbeat_monitoring“, you can remove the role „metricbeat_setup_role“:
Update the user with this role.
Enable and Run metricbeat
Ok, that’s it. you can run now Metricbeat:
systemctl enable metricbeat
systemctl start metricbeat
Conclusion
If you made it here: Congratulations! You should now be able to run Metricbeat with secure communication. In case you are missing a specific configuration, the metricbeat reference has a lot more examples – please have a look.
If you have questions, leave a comment, connect or follow me on LinkedIn